Factors of Irrigation Management
To manage your irrigation effectively you must know:
-
How much water can be stored in the soil?
-
How much water is entering the soil?
-
When is water needed?
Each of these factors is discussed in the next section. Worksheets and examples are provided at the end of this section, along with conversion tables and additional sources of information.
Depending on the number of irrigation zones, calibrating and scheduling irrigation takes about half a day. After the calibration, scheduling only takes a couple of minutes a week.
1. How much water can be stored in the soil?
Soil Type: Physical Properties
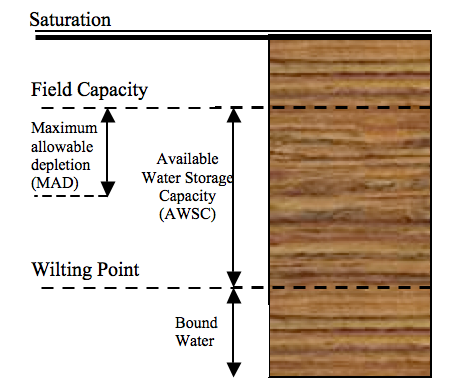 The physical properties of different soils determine how they take in, store, and release water. Field capacity refers to the total amount of water that is held in the soil after it has been saturated, then drained by gravity. A portion of water in the soil is held by the soil particles and is unavailable to the tree; this is bound water. The remaining water in the soil is called the available water storage capacity (AWSC); this is the reservoir the trees have to draw on. The goal of irrigation scheduling is to operate between field capacity and 60% available water storage capacity. The orchard is at field capacity after irrigation and is irrigated again when the soil moisture drops to 60% of the available water storage capacity. This wet-dry cycle allows oxygen to move into the soil.
The available water storage capacity (AWSC) is the amount that can be extracted before permanent wilting. The maximum soil water deficit (MSWD) is the amount of water that can be extracted before the trees experience water stress; for fruit trees, the MSWD is 40% of the AWSC. When the MSWD is reached it is time to irrigate.
Figure 1 shows the relative amounts of bound water, available water, and field capacity in sand, loam, and clay. Clay holds more water than sand and loam at field capacity, but the amount of available water in clay is nearly equal the amount in loam. This is because clay has a higher proportion of bound water.
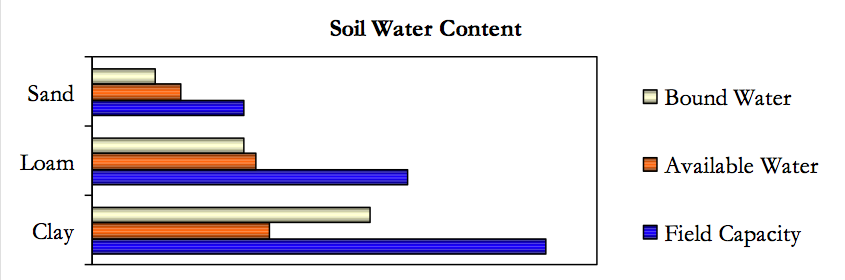
Figure 1 The relative amounts of bound water, available water and field capacity in sand, loam and clay.
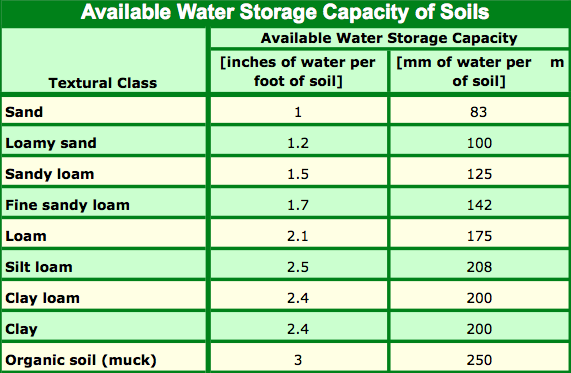
The available water storage capacity is shown in Table 1 for different soil types at specific depths. The values given for the AWSC are the upper limits for each soil type; these values will decrease as the amount of rock and stone in the soil increases.
Table 1 Available Water Storage Capacity of Soils
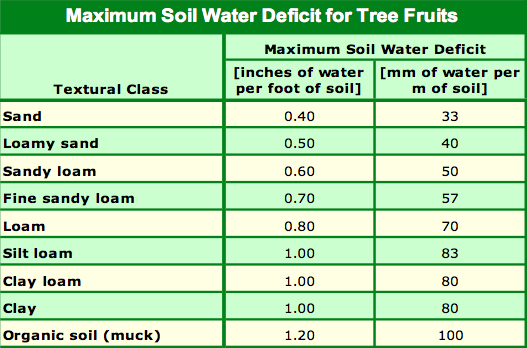
For tree fruits only 40 percent of this water is available for the tree to consume.
Table 2. Maximum Soil Water Deficit for Tree Fruits
To determine the total amount of water that can be stored for plant growth the rooting depth of the tree must be taken into account.
Table 3. Rooting Depth of Fruit Trees
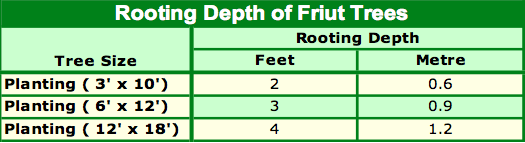
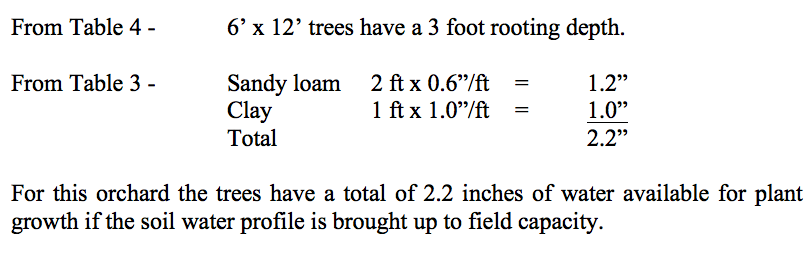
Example: An orchardist has cherry trees with 6’ x 12’ spacing. His soil type is sandy loam for the first 2 feet and clay for the next 2 feet. How much water can be stored in his soil profile that the trees to can use?
2. How to Determine your soil type(s)
Check the soil in several locations as soil type can vary considerably in an orchard block. It is important to know the soil type in the top metre of soil. Although trees may have roots up to 2 metres deep in the soil, at least 85% of the roots are in the top metre
Most orchards will have different types of soil at different depths so be prepared to take multiple samples and record the thickness of each layer.
For each site:
Dig a hole 1 metre deep and sample soil at 30, 60 and 90 cm. You can also use an auger to obtain soil at these depths; however, it is difficult to measure the thickness of any layers with this method.
-
If the soil looks uniform throughout the depth of the hole:
Combine the samples into one jar and label it. -
If there are layers of different soil types:
Measure the thickness of each layer and record it. Sample each layer, DO NOT mix them together. Keep each layer sample in its’ own jar.
Once the samples have been collected choose one of two methods to determine the soil type.
-
Laboratory Analysis
Many labs will do a soil particle analysis that reports the percentages of clay, sand and silt in the sample. Ask field service for soil testing labs in your area. Using this information, find the soil type using the soil textural triangle (Appendix 1).
Cost: ~ $25 per sample -
Hand Feel Method
The hand feel method can be done in the field and is relatively easy. It is, however, very subjective and leaves a lot to be desired in terms of accuracy. If this method is chosen, use the flow chart (Appendix 2) at the end of the section. It is a good idea to keep the samples for a second opinion.
3. How much water is entering the soil?
Water Application Rates & Volumes
Irrigation systems can differ in their rate, uniformity and efficiency of water application. All of these variables influence irrigation management.
Infiltration rates determine how much and how quickly water can be taken in by the soil. If the rate of water application exceeds the infiltration rate, ponding and runoff occur.
Table 4. Maximum Application Rates for Various Soil Types
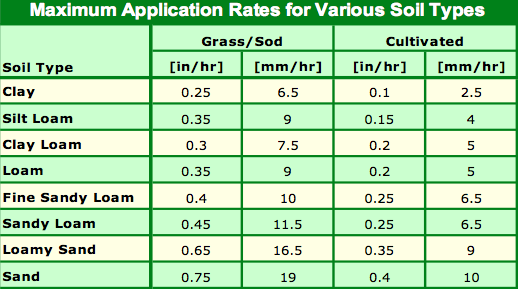
Due to differences in infiltration rates and available water storage:
-
Clay soils should be watered slowly, for a long time, infrequently.
-
Sandy soils can have water applied at higher application rates but for short periods of time, frequently.
-
Loam soils are intermediate between clay and sand.
Application Rate: This is the volume of water applied over a period of time. Problems arise when the irrigation application rate exceeds the infiltration rate (rate at which the soil can absorb water).
Application Uniformity: This refers to how evenly the irrigation system applies water to the soil. For example, an irrigation line that runs from the top to the bottom of a hilly section may apply more water at the bottom of the hill than the top.
Application Efficiency: This refers to the amount of water that is actually applied to the orchard floor. Some systems, such as overhead irrigation, have low efficiencies due to the amount of water lost to evaporation. The ranges given are for systems that were properly designed and are in good working order.
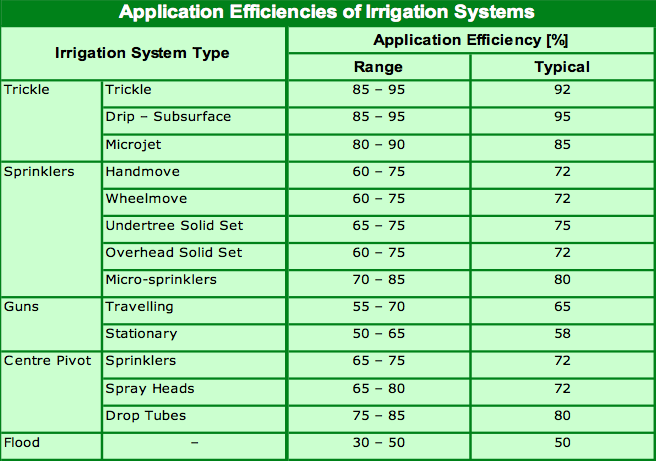
Table 5. Application Efficiencies of Irrigation Systems
Application Rates
To schedule irrigation sets you must know the rate at which water is to be applied. Make sure your irrigation system is in good operating condition before doing the calibration. You may consider hiring an irrigation consultant to conduct a pre-calibration check and also to calculate the water output of your calibrated system.
-
Repair any leaks
-
Repair and replace nozzles as necessary – use drill bits to test for wear
-
Consider installing flow control valves if there is a lot of pressure variation in the lines as this will even out the water application
-
Ensure meters and pumps are working properly
System Design Method
Water Application Rates (AR) can be calculated based on the irrigation system parameters (pressure, nozzle size, etc.).
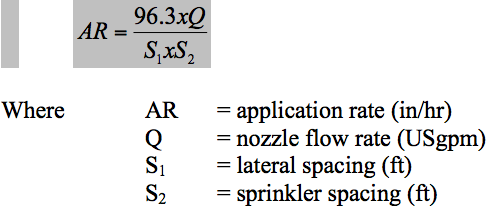
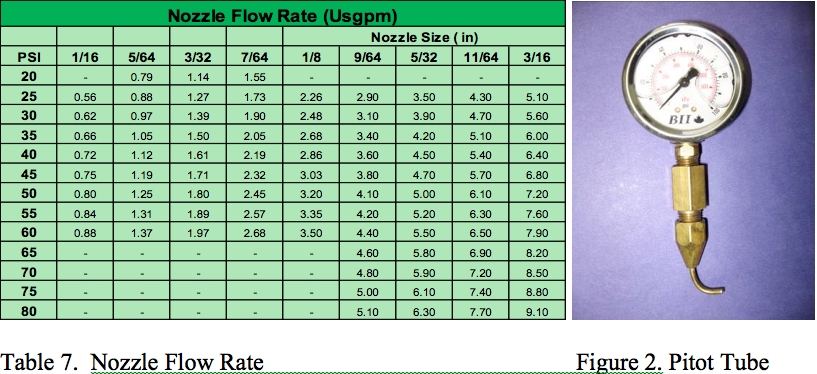
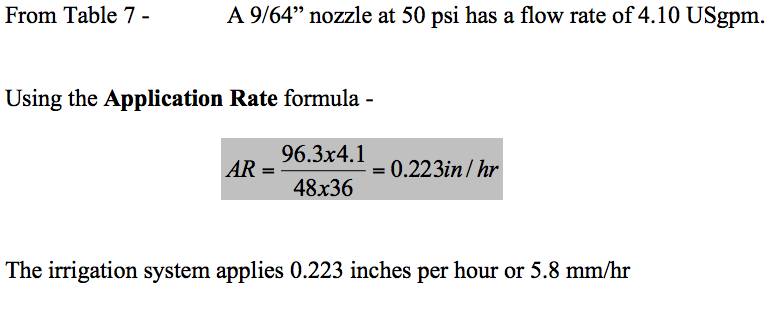
To use this method the nozzle size and pressure need to be known. The nozzle size should be on the side of the nozzle. If the nozzles are old the size can be checked with a drill bit. The pressure can be read with a pressure gauge and a pitot tube (figure 2). If the orchard is on flat ground the pressure at the supply connection can be used if it is reduced by 10 percent. Table 6 lists nozzle flow rates.
Table 6. Flow Rates of Various Nozzle Sizes
Example: The orchardist with cherry trees in the previous example has a sprinkler spacing of 36’ x 48’. His 9/64” nozzles have a pressure of 50 psi. What is his nozzle flow rate and how much water is he applying per hour?
For more information on these calculations refer to the B.C. Trickle Irrigation Manual and the B.C. Sprinkler Irrigation Manual. These can be obtained through the Irrigation Industry Association of British Columbia at 604 859-8222 or online at http://www.irrigationbc.com.
The Metered Method
If you have a water meter on your irrigation line you can use it to determine how much water you are applying to the orchard. This method assumes there are no major leaks in the system and that there is even water distribution throughout each zone.
-
Find the number of acres per zone (Worksheet 1).
-
Record the metre reading.
-
Turn on the irrigation for 1 hour.
-
Read the metre after 1 hour.
-
Calculate how many inches are applied per hour for each zone. (Worksheet 2).
The Pan Method (Sprinklers)
The catch pan method can also be used to physically measure the amount of water applied. This method is described in detail in appendix 4.
Application Efficiency
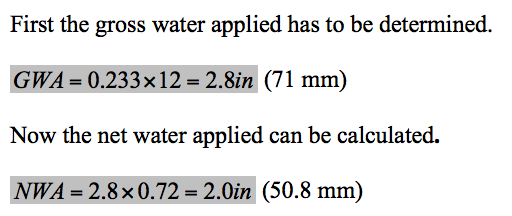
Gross Water Applied, (GWA) Now that the application rate is known the gross water applied can be determined from the sprinkler run time.

Net Water Applied, (NWA) Not all of the water that is applied by the sprinkler enters the soil. Water is lost to evaporation and runoff. Table 6 lists the application efficiencies of various irrigation systems.

Example: The orchardist with cherry trees in the previous example is using an over head solid set sprinkler system. The system operates for 12 hours per set. What is the net water applied by the system?
Note: This number should be less than the Total Available Water Storage Capacity or over irrigation is occurring.
4. When is water needed?
Knowledge of how much water is in the soil is essential to irrigation scheduling. There are two approaches to determining soil water: direct soil moisture monitoring and a cheque-book method that keeps track of how much water is lost to evapotranspiration.
A. Soil Moisture
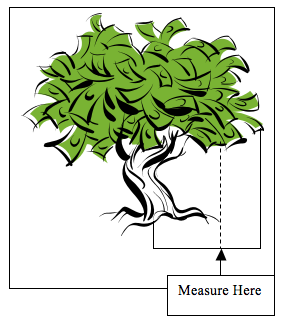
Some of the tools available for measuring soil moisture are discussed below. When a threshold is met (e.g. soil tension) the orchard is irrigated. Most manufacturers provide information on when to water with the equipment. Soil moisture should be monitored about 2/3 of the canopy width from the trunk (see figure).
1. Hand Feel Method
The hand feel method is based on the texture of the soil. An auger is used to obtain soil samples from various depths. Use Appendix 3 to determine the soil moisture. Find the soil type in the top row and choose the appropriate texture from the choices listed underneath. The column on the left shows the approximate soil moisture for the different textures. For tree fruits, the soil moisture should not drop below 50%. Though very affordable this method is not very accurate, difficult in rocky areas and requires a lot of effort and skill.
2. Tensiometers
Tensiometers work by directly measuring the soil-water potential. As the amount of water in the soil decreases the tension increases. This tension can be read from the tensiometer in centibars and used with a chart (provided by the manufacturer) to determine the amount of water in the soil. The higher the reading, the drier the soil is. Some maintenance is required – tensiometers must be protected from frost. This means removing them every fall and reinstalling them in the spring. The tips should be flushed and occasionally replaced. The instrument must be installed properly (so the tip has good contact with the soil) to obtain accurate readings.
Some manufacturers make a number of models that are suited to different soil conditions and crop sensitivities. Low-tension models can be used for coarse, sandy soils as they are more sensitive and respond faster to changing water conditions. Tensiometers respond faster and are more accurate than electrical resistance blocks.
Tensiometers in orchards should be installed in pairs – one at a depth of 30cm and one at 60cm. Each area that differs from other areas in soil type and slope should be equipped with a pair of tensiometers to monitor soil moisture accurately. The exposed parts of the equipment must be protected from mechanical damage.
Cost:
-
Tensiometer ~ $90-100 each
-
Service Kit ~ $50-85
3. Electrical Resistance Blocks
Electrical resistance blocks (ERB’s) provide an indirect measure of soil-water potential by measuring the resistance across a block that is buried in the soil. Two wires lead from the block that can be connected to a portable meter to obtain the soil-water tension reading in centibars. One meter can be used to monitor numerous ERB’s. Like tensiometers, ERB’s should be installed in pairs at depths of 30 and 60cm in each unique area of the orchard. Unlike tensiometers, ERB’s are not damaged by frost and can be left in the ground over the winter.
The only parts exposed above ground are two wires. ERB’s do not respond as quickly as tensiometers and are not suggested for use in light, rapidly draining soils such as sand. The blocks should last 5-7 years under normal conditions – less in acidic soils. Check the accuracy of sensors by soaking them overnight in water. The closer the reading is to zero the more accurate it is. Blocks should be replaced when they read 5 or higher after soaking overnight.
Cost:
-
Blocks ~ $50 each
-
Meter ~ $425
4. C-Probe
The C-probe is a soil-moisture monitoring probe that uses capacitance sensors. Up to 6 sensors can be set at multiple depths along the probe. Continuous readings at multiple sensing depths result in a comprehensive look at the root zone soil-water profile and allow precise irrigation management. Readings are transmitted via radio data loggers to a software platform such as ADCONtm. The use of telemetry eliminates the need for manual readings or wiring to a data-logging device. C-probes work very well in loams, silts, and clays. They work in sands as well but will report “spiky” data due to the rapid movement of water through coarse soils. C-Probes can be used to monitor the volume of water lost from the soil, so one unit can be sufficient for a large operation. Maintenance involves checking the o-ring and seal twice a year. Growers in the Okanagan Valley can contact Growers Supply Co. Ltd. for installation and data acquisition options.
Cost:
-
Probe: ~ $840
-
Sensors: ~ $300 each
-
Receiver: ~ $1200 or $3500 (depends on location)
-
Receiver Mounting Poles: $145 each (minimum of 2 required)
B. Evapotranspiration (Et)
Irrigation sets can be timed by monitoring how much water has been used by the crop and lost to evaporation. Evapotranspiration is the amount of water that is lost through plant respiration and evaporation from the soil. It is used to schedule irrigations based on a soil-water balance approach: water that is lost must be replaced. Unlike the methods discussed above, evapotranspiration tells the orchard manager how much water needs to be replaced. There are a number of ways to estimate Et – they all include the effects of weather and location.
1. Meteorological Calculations
Evapotranspiration data is usually reported in millimetres lost over time. Currently growers need access to the internet to obtain this information. It is recommended that there be a secondary form of monitoring as back-up for the first season. This will allow growers to calibrate the use of ET data for their specific blocks.
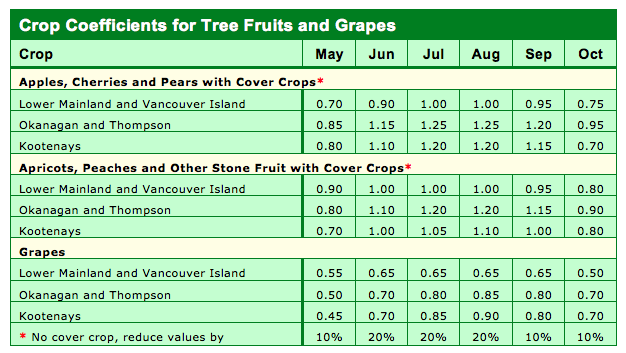
Evapotranspiration data is available on the internet at www.farmwest.com. Be sure to multiply the reported evapotranspiration by the appropriate crop coefficient (Table 7). Field staff can also be contacted to provide this information.
Table 7. Crop Coefficients for Tree Fruits and Grapes
To use evapotranspiration data you must know your Net Water Applied (NWA). On the website, look up the evapotranspiration since the last day you irrigated your first set or zone. When the evapotranspiration is close to your NWA, irrigate to replace the lost water.
Example: The orchardist with cherry trees in the previous examples has just finished the irrigation cycle. Using data from Farmwest.com determine when irrigation is required again.
For this example the farmer is in Kelowna and irrigation began on June 15th, 2009. The orchard was designed on a 7 day irrigation interval. In the previous example the net water applied (NWA) was calculated at 50.8 mm. From the Farmwest.com website click on the evapotranspiration box.
![]()
Select the region, station and enter the dates. Click Go.
![]()
Keep in mind that this ET value is for a grass reference crop. From table 8 the crop coefficient for Apples in the Okanagan is 1.25.
CropET = 37x1.25 = 46.33mm
The remaining water in the soil is:
CropWater = 50.8-46.3 = 4.5mm
Now a management decision needs to be made on whether to irrigate tomorrow or wait one more day. This is climatic irrigation scheduling as it has been done for some time. Now a new method is available which removes the math and allows the farm information to be stored on a private account.
Agricultural Irrigation Scheduling Calculator
The Agricultural Irrigation Scheduling Calculator is available on the Irrigation Industry Association of British Columbia website. http://www.irrigationbc.com.

The calculator will allow you to create a private account. In your account all your field dimensions, crop, soil, and irrigation system types can be entered and remembered. Once this is entered scheduling can quickly be done on any of the fields. Several user guides are available on the site to help enter the data properly and schedule the irrigation system.
User Guides:
-
Agriculture Sprinkler Calculator Guide
-
Agriculture Drip Irrigation Guide
-
Agriculture Pivot Calculator Guide
-
Agriculture Traveling Gun Calculator Guide
-
Agriculture Stationary Gun Calculator Guide
2. Evaporation Pans
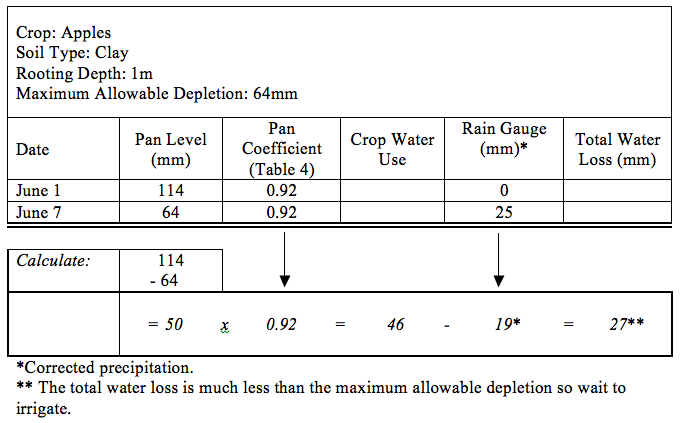
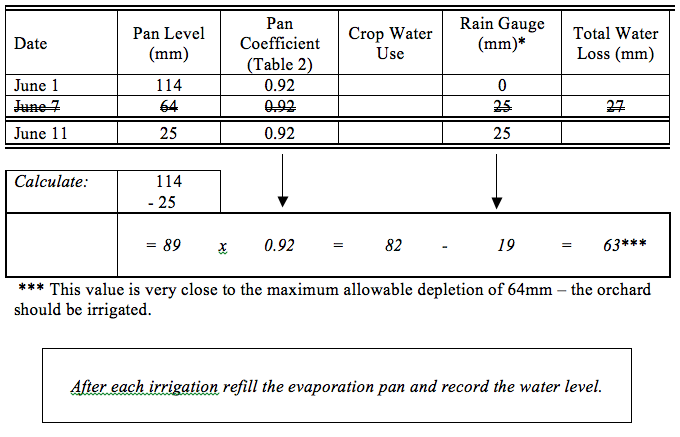
Evaporation from a galvanized washtub exposed to the same climatic conditions as the crop can be proportional to the crop water use. Evaporation from the pan will vary depending on the pan size and type, location, and water depth. In order to be used accurately, evaporation pans must be constructed and installed properly. A standard Evaporation pan, developed by the U.S. Weather Bureau, is 47.5’’ in diameter and 10’’ deep. It is constructed of #22 galvanized steel and elevated 6’’ off the ground on a wooden slat platform. The pan must be level and have a ruler for measuring the water level. The water level should be kept within 6-8’’ of the top and must be filled after each irrigation set. A wire grate to exclude animals and debris should cover the pan and be kept clean of any debris. Algae and other organic growths should be prevented using small concentrations of copper sulfate (5-10 mg of product per liter of water). Any rust must be repaired and painted the same colour as the rest of the pan. Measurement should be recorded around the same time each day. Loss from the pan is multiplied by a pan coefficient to estimate the crop water use (Table 4). A rain gauge with a small amount of mineral oil in it must accompany the pan to account for additions due to precipitation. When the corrected evapotranspiration reaches 60% of the available water capacity, irrigate the orchard (BCMA 2001a, UOF-IFAS 2000). Evaporation pans can be ordered from Geneq Inc.
How to: Schedule Irrigation using an evaporation pan
-
Calculate the maximum allowable depletion (described at the beginning of this section). Record this on Worksheet 2. If there is more than one pan use a separate sheet for each.
-
After the first irrigation of the season, fill the pan and record the water level.
-
Periodically check the water level and calculate the crop water use.
a) Record any precipitation greater than 6mm in the rain gauge. Multiply the precipitation by 0.75. This is the corrected precipitation.
b) Figure out how many mm have been lost from the evaporation pan by subtracting the current water level from the water level after the last irrigation.
c) Multiply the depth of water lost by the pan coefficient (Table 4) for that month. This is the corrected water use.
d) Subtract the corrected precipitation from the corrected water use to find the crop water use.
4. When the crop water use is close to the maximum allowable depletion, irrigate the orchard, refill the evaporation pan and record the new water level, and empty the rain gauge if necessary. Remember to replace the mineral oil in the rain gauge.
Table 8. Pan Coefficients for Tree Fruits

Example: Using pan evaporation to calculate crop water use.
3. Atmometers
An atmometer consists of a water-filled cylinder equipped with a porous ceramic cup. A crop-specific membrane covers the cup to mimic crop water use. As water evaporates from the cup the level of water in the cylinder drops and the level can be recorded. Early in the season the readings must be multiplied by a crop coefficient to account for partial canopy cover. In order to use the readings for irrigation scheduling the initial amount of water in the soil must be known, as well as the available water capacity of the soils. Maintenance includes protection from freezing and ensuring the reservoir has enough (distilled) water. Atmometers provide accurate, site specific ET data provided they are installed away from buildings and obstructions in a representative area. Atmometers can be ordered from C & M Meteorological Supply.
Cost:
-
~ $500-1500 (depends on model chosen)